
The Payroll Protection Plan Subsidized 1 of 3 Jobs in Q2
On July 6, the US Treasury released details on all loans issued as part of the Paycheck Protection Program. It shouldn’t be surprising to anyone who regularly deals with banking data –or any data really – that the PPP data is quite messy. That does not mean it’s useless and should be completely ignored. With some data cleaning and a grain of salt, we can get a high-level view of the impact of the program.
One of the most intriguing questions about the efficacy of the program is what proportion of the job market was subsidized by the PPP. The US lost more than 20 MM jobs in April after unprecedented government stimulus. How many jobs would have been lost without that stimulus? It’s a frightening question, and one that can’t be perfectly answered. Not all jobs that were reported as ‘retained’ under PPP would have been lost without the program. And not all jobs that were saved by government action were saved by the PPP. Still, comparing the number of jobs retained to the overall size of the labor market illustrates how important the program was for stemming the unemployment crisis.
As with any data analysis, these findings should be viewed with a clear understanding of the data collection, cleaning, and analytical methodologies used. Before we get into the weeds, I should make some specific call-outs:
Other than the changes mentioned below, the data is presented “as-is.” It is assumed that the loan amount, jobs retained, and NAICS code information are all filled out correctly on each loan application
In total, I dropped 752,122 rows, representing 9.4% of all dollars originated through the program:
530,026 rows where the number of jobs retained is 0 or negative
222,096 rows where the NAICS code was missing or invalid
To compare the number of jobs retained to the total number of jobs available in a given market, we will pull the BLS CES Establishments Survey data by Super Sector.
This categorization is slightly different than the NAICS sectors reported by the SBA, but it allows us to match to AQN’s unemployment reporting while remaining high-level
Drilling deeper into NAICS codes is likely to result in a larger classification error, which would skew the results of this analysis
This analysis does not account for other CARES Act and related stimuli that likely impacted employment levels at larger corporations
With that out of the way, we can get to the interesting stuff. Let’s begin with the startling fact that, according to this data set, more than 1 in 3 jobs in the US were subsidized in some way by this program.
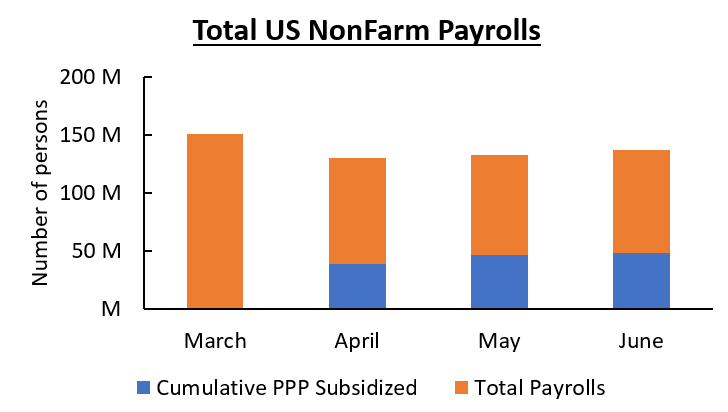
Figure 1 — SOURCE: AQN analysis of PPP data via SBA; BLS CES
The overall economy added jobs in June, primarily from the return of jobs in sectors hardest hit by stay-at-home orders. This rehiring was certainly aided, at least in part, by the offset of payroll costs benefiting small businesses through the end of June. Of the 137 MM jobs in June, 35% of them were covered by PPP loans.
The point is particularly poignant when we drill down into the Leisure and Hospitality sector. The PPP data implies that 87% of the leisure and hospitality jobs that were not lost in April were subsidized by Uncle Sam. It’s impossible to know the extent that PPP helped to curtail the jobs crisis in April because some subsidized jobs may have survived without help. However, it’s clear that the program was successful in reducing the the unemployment rate.

Figure 2 — SOURCE: AQN analysis of PPP data via SBA; BLS CES
Looking across the board, we can add Construction, Non-durable Goods Manufacturing, Mining and Logging, and Other Services, to the list of heavily subsidized industries. Of course, the number of eligible businesses in each sector plays a large part here; there aren’t many organizations that are both eligible for PPP loans and classified as a state or local government, for example.
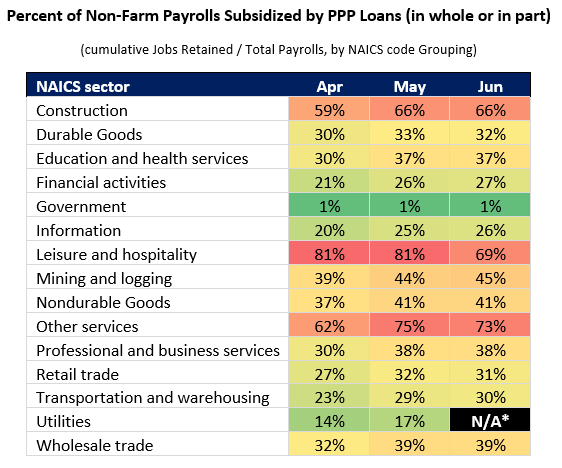
Figure 3 – SOURCE: AQN Analysis of PPP Data, BLS CES; *Note: Utilities payroll data not available for June; Other Services includes service sector industries not included in Leisure and Hospitality, Professional and business service, or Education and health.
While the unemployment crisis that began in April was historic, these numbers imply that we avoided a much worse fate. If all of the 39 MM jobs the PPP covered in April were lost, then the 15% decrease in employed persons would have been 41%. Even if only half of those 39 MM jobs were lost, the unemployment benefits infrastructure would have been all the more clogged, businesses in the hospitality and travel industries would have been all the more on the brink of closure, and the unemployment rate would have put the stats from the Great Depression to shame.
This is only a single view into the impact the program had on holding together the US economy during the early months of the COVID-19 Pandemic. There are many other angles worth exploring such as comparing the average benefits that ultimately ended up in the hands of employees to unemployment benefits and considering the geographic correlation between PPP support and jobs losses. As the unemployment crisis continues to unfold, AQN will continue to monitor the situation and provide actionable updates to our clients.
If you are interested in staying up to date on unemployment stats, contact us to subscribe to our monthly presentation on the unemployment situation.